Lytx Shares New Insights on Risky Driving Trends Among Transit Fleets
.jpg)
- Near collisions occurred 31% more frequently among transit operators/drivers, potentially demonstrating skill in avoiding collisions
SAN DIEGO — May 21, 2020 — From its unmatched database of 808,000 risky driving events captured from transit fleets in 2019, Lytx® today released new insights into transit industry driving trends.
Lytx’s findings include the five risky behaviors seen most often among transit drivers, most improved driving behaviors, and insights on how transit industry driving habits compare to those of other industries.
This data was captured from fleets of all sizes and types within the transit industry, including taxi, limousine, airport shuttle, coach and school bus fleets, among others. It is part of an ongoing series from Lytx highlighting key behavior trends seen across the nine industries that utilize its video telematics technology, with the goal of informing and supporting ongoing safety efforts in the industries it serves.
The data will be released twice weekly through May 26 here: https://www.lytx.com/en-us/industry-benchmark-data.
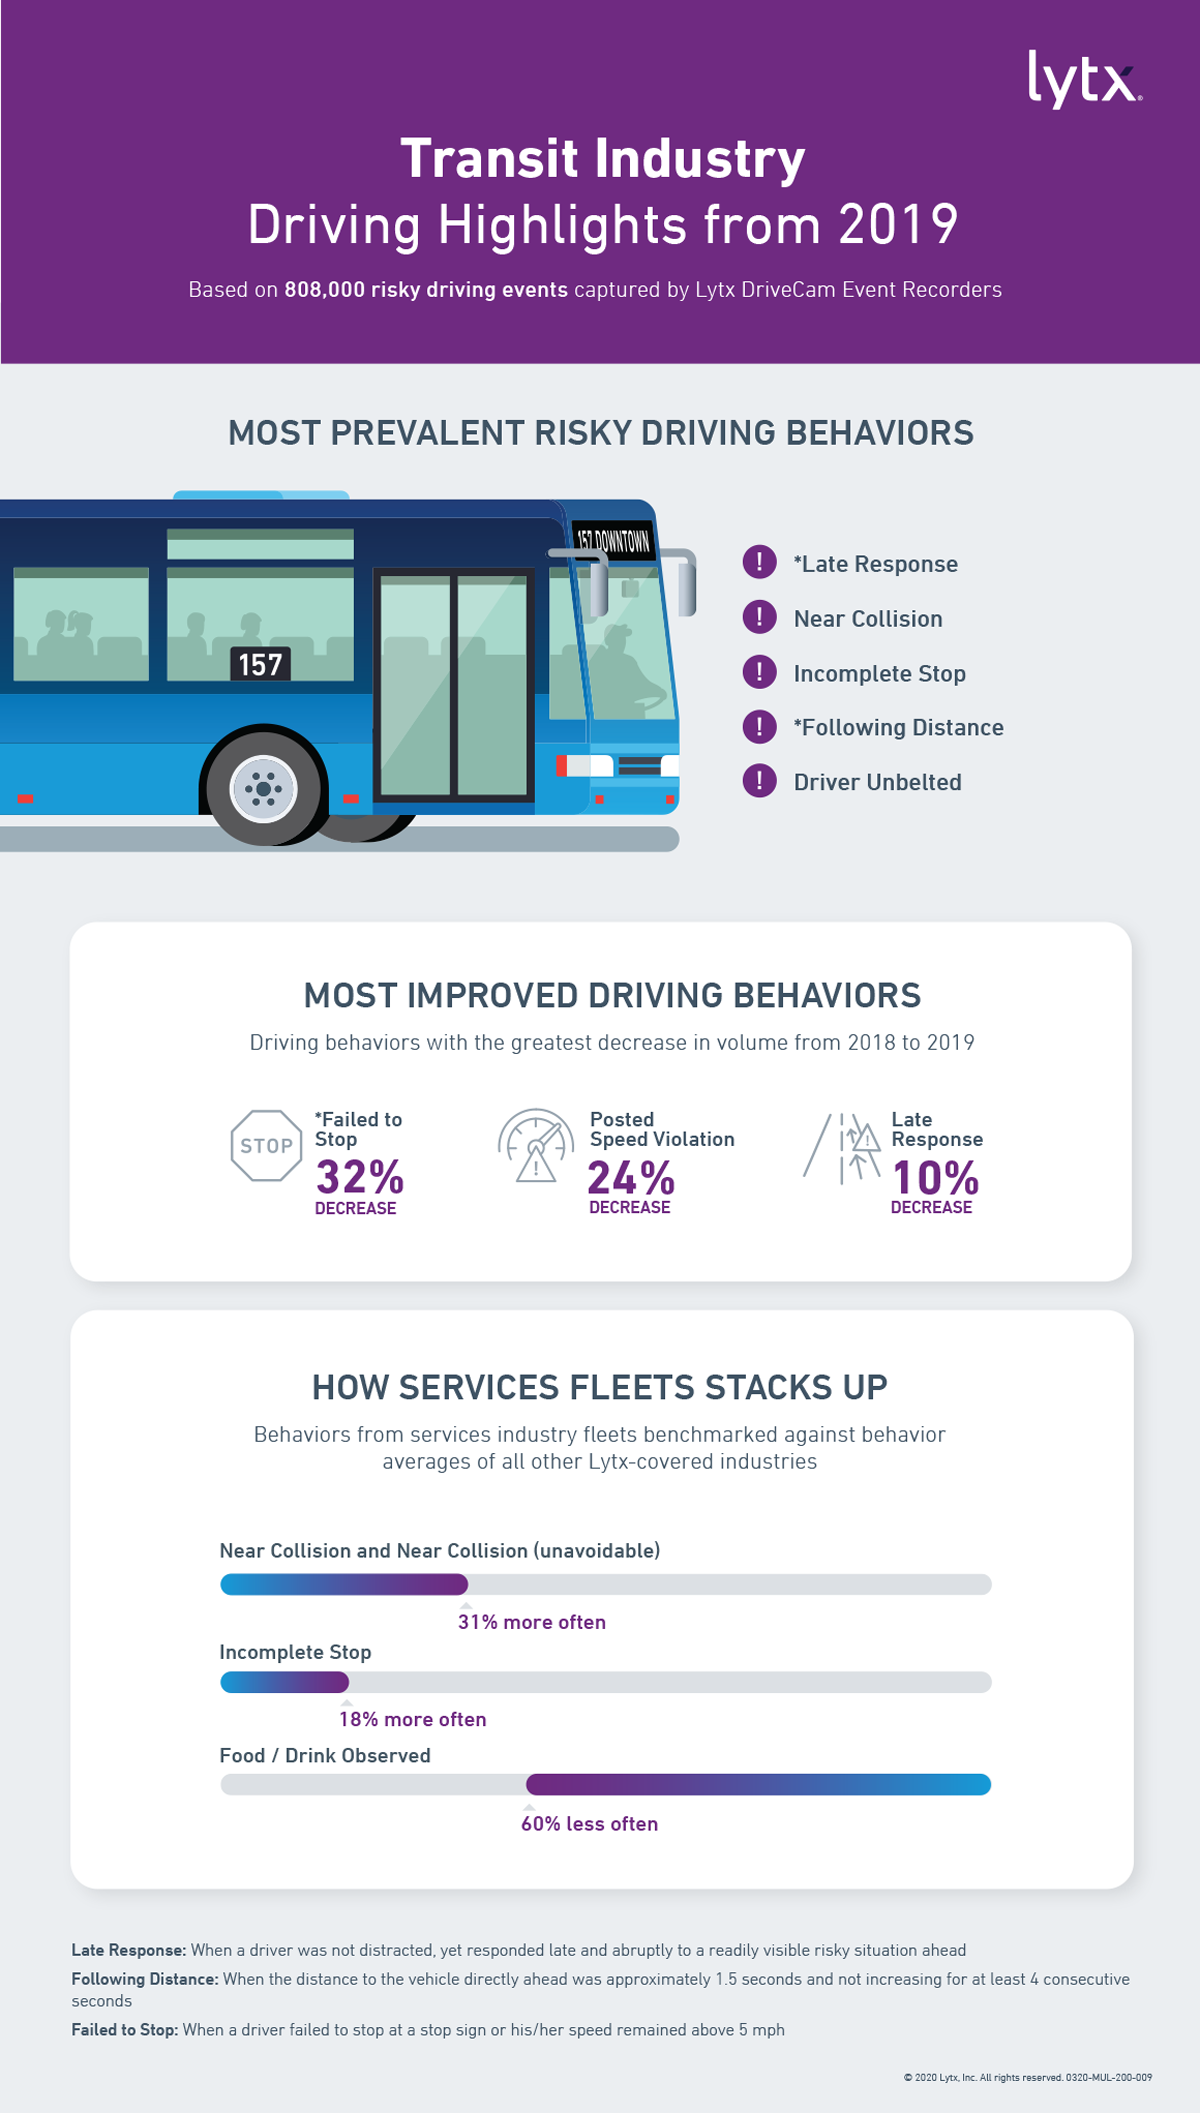
Most Prevalent Risky Behaviors in 2019
- Late response*
- Near collision
- Incomplete stop
- Following distance**
- Driver unbelted
Most Improved Behaviors from 2018 to 2019
- Failure to stop*** – improved 32%
- Posted speed violation – improved 24%
- Late response* – improved 10%
Behaviors may appear on both the "Most Prevalent" and "Most Improved" lists. This demonstrates that even with significant improvement, fleets and drivers must stay vigilant and maintain awareness to keep those behaviors trending downwards.
How Transit Fleets Stack Up Against Other Industries
Lytx compared the prevalence of behaviors seen in transit fleets against behavior averages of fleets across all of its other protected industries. Comparatively, transit fleets stood out in the following areas:
- Near collision/near collision (unavoidable) occurred 31% more often
- Incomplete stop occurred 18% more often
- Food/drink observed 60% less often
Common risky driving behaviors observed within a fleet, as well as benchmarking data from fleets both inside and outside of a specific industry are helpful metrics for understanding industry-specific challenges, guiding safety efforts and then measuring success. To better identify and address top areas of driving risk within their individual fleets, thousands of organizations use the best-in-class Lytx Driver Safety Program; these organizations experience on average up to 50% reduction in collisions and up to 80% on associated claims costs as a result.
Transit Collision Insight
Lytx also found that 57% of high-impact collisions in the transit industry were attributed to fundamentals or traffic violation behaviors, such as “failure to stop” or “too fast for conditions,” indicating an opportunity for increased operator and driver coaching in this area.
About the Data
These insights were derived from Lytx’s proprietary database of transit driving data from 2019, including 808,000 risky transit driving events captured last year. For comparisons across industries, Lytx calculated behavior averages from its global database, which contains driving data from trucking, distribution, concrete, construction, services, utilities, government and waste industries. Lytx maintains the fastest-growing proprietary database of professional driving data in the world, currently surpassing 120 billion miles of driving data. The data is anonymized, normalized and in instances of behavior prevalence, is generalizable to transit fleets at large.
About Lytx
Lytx® is a leading provider of video telematics, analytics, safety, and productivity solutions for commercial, public sector, and field services fleets. Our unrivaled Driver Safety Program, powered by our best-in-class DriveCam® Event Recorder, is proven to help save lives and reduce risk. We harness the power of video to help clients see what happened in the past, manage their operations more efficiently in the present, and improve driver behavior to change the future. Our customizable services and programs span driver safety, risk detection, fleet tracking, compliance, and fuel management. Using the world’s largest driving database of its kind, along with proprietary machine vision and artificial intelligence technology, we help protect and connect thousands of fleets and more than 1.3 million drivers worldwide. For more information on Lytx telematics system, visit http://www.lytx.com, @lytx on Twitter, LinkedIn, our Facebook page or our YouTube channel.
*Late response occurs when a driver is not distracted, yet responds late and abruptly to a readily visible risky situation ahead.
**Following distance refers to a risky driving event in which the distance to the vehicle directly ahead is approximately 1.5 seconds and not increasing for at least 4 consecutive seconds.
***Failure to stop occurs when a driver fails to stop at a stop sign or his/her speed remains above 5 mph.
# # #

