


Annual Risk and Collision Analysis
Lytx Data
Lytx analyzed and labeled more than 50 million risky driving events in 2019. By combining machine vision and artificial intelligence with professional review, we’re able to present a customized and accurate view of risk to our clients, with greater than 95% accuracy across more than 60 risky driving behaviors. We also derive insights on the most prevalent risky behaviors and the most improved driving behaviors at the industry-level, for fleets in each industry we serve: Concrete, Construction, Distribution, Government, Services, Transit, Trucking and Waste, in our “Annual Risk and Collision Analysis.” Our database is comprised of 120 billion miles of driving data and is the largest of its kind. We use and share this information to help fleets of all sizes and types -- whether they have 5 vehicles or 25,000 – save lives, reduce risk, and improve efficiency.
Concrete Industry Driving Risk
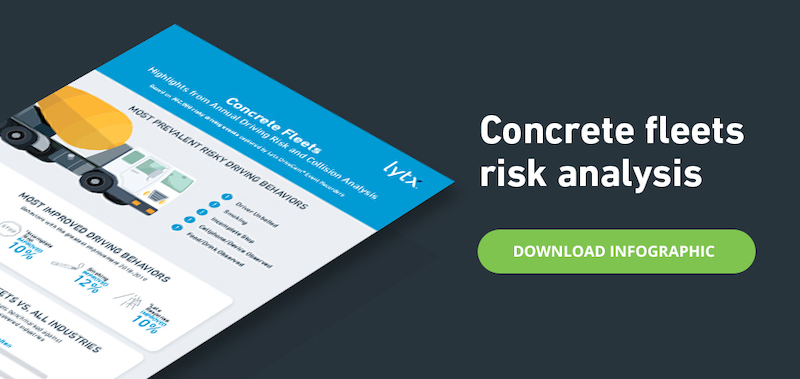
Lytx’s findings include the five risky behaviors seen most often among drivers of concrete vehicles, the most improved driving behaviors, and insights on how concrete-industry driving habits compare to those in other industries.
This data was captured from fleets of all sizes and types within the concrete industry, including those in ready mix, aggregate, concrete supply, rock, and asphalt.
.jpeg "0420-MUL-200-031-banner-concrete-fleets-download-D2-(1).jpeg")
MOST PREVALENT RISKY BEHAVIORS IN 2019
- Driver unbelted
- Smoking
- Incomplete stop
- Cellphone/device observed
- Food/drink observed
MOST IMPROVED BEHAVIORS FROM 2018 TO 2019
- Following distance1 – 46% decrease
- Smoking – 12% decrease
- Incomplete stop – 10% decrease
- Late response2 – 10% decrease
HOW CONCRETE FLEETS STACK UP AGAINST OTHER INDUSTRIES
Lytx compared the prevalence of behaviors seen in concrete fleets against behavior averages of fleets across all its other protected industries. Comparatively, concrete fleets stood out in the following areas:
- Following distance1 occurred 27% less often
- Driver unbelted, which occurred 58% more often
- Food/drink, which was observed 38% more often
CONCRETE COLLISION INSIGHT
Lytx also found that 13.9% of collisions in the concrete segment were high or medium impact, and identified drivers driving “too fast for conditions”3 as the leading cause of high-impact crashes in the segment.
ABOUT THE DATA
These insights were derived from Lytx’s proprietary database of concrete driving data from 2019, including 302,000 risky concrete driving events captured last year. For comparisons across industries, Lytx calculated behavior averages from its global database, which contains driving data from construction, trucking, distribution, utilities, services, transit, government, and waste industries. Lytx maintains the fastest-growing proprietary database of professional driving data in the world, currently surpassing 120 billion miles of driving data. The data is anonymized, normalized, and in instances of behavior prevalence, generalizable to concrete fleets at large.
Construction Industry Driving Risk
Lytx’s findings include the five risky behaviors seen most often among construction drivers, the most improved driving behaviors, and insights on how construction-industry driving habits compare to those in other industries.
This data was captured from fleets of all sizes and types within the construction industry, including commercial and residential construction, contractors, builders, excavation, lumber, roofing fleets, and more.

MOST PREVALENT RISKY BEHAVIORS IN 2019
- Driver unbelted
- Late response2
- Smoking
- Other distraction4
- Food/drink observed
MOST IMPROVED BEHAVIORS FROM 2018 TO 2019
- Cellphone/device observed – improved 50%
- Incomplete stop – improved 20%
- Posted speed violation – improved 27%
- Passenger unbelted – improved 12%
HOW CONSTRUCTION FLEETS STACK UP AGAINST OTHER INDUSTRIES
Lytx compared the prevalence of behaviors seen in construction fleets against behavior averages of fleets across all its other protected industries. Comparatively, construction fleets stood out in the following areas:
- Posted speed violation, which occurred 16% less often
- Smoking, which occured 69% more often
- Other distraction4, which occurred 32% more often
CONSTRUCTION COLLISION INSIGHT
Lytx also found that 91% of collisions in the construction segment were low impact. Late response2, one of the most prevalent behaviors in this space, contributed to 32% of low-impact rear-end collisions.
ABOUT THE DATA
These insights were derived from Lytx’s proprietary database of construction-driving data from 2019, including 192,000 risky construction driving events captured last year. For comparisons across industries, Lytx calculated behavior averages from its global database, which contains driving data from trucking, distribution, concrete, utilities, services, transit, government, and waste industries. Lytx maintains the fastest-growing proprietary database of professional driving data in the world, currently surpassing 120 billion miles of driving data. The data is anonymized, normalized, and in instances of behavior prevalence, generalizable to construction fleets at large.
Utilities Industry Driving Risk
Lytx’s findings include the five risky behaviors seen most often among utilities drivers, most improved driving behaviors, and insights on how driving habits in the utilities industry compare to those in other industries.
This data was captured from fleets of all sizes and types within the utilities industry, including cable and telecommunication fleets and oil- and gas-hauling vehicles.

MOST PREVALENT RISKY BEHAVIORS IN 2019
- Near collision
- Near collision (unavoidable)
- Food/drink observed
- Following distance1
- Smoking
MOST IMPROVED BEHAVIORS FROM 2018 TO 2019
- Driver unbelted – improved 49%
- Cellphone observed – improved 24%
- Food/drink observed – improved 15%
HOW UTILITIES FLEETS STACK UP AGAINST OTHER INDUSTRIES
Lytx compared the prevalence of behaviors seen in utilities fleets against behavior averages of fleets across all its other protected industries. Comparatively, utilities fleets excelled in the following areas:
- Cell phone use, which was observed 54% less often
- Late response2, which occurred 62% less often
UTILITIES COLLISION INSIGHT
While cell phone use is improving in the utilities industry, it remains a risk. Lytx found that driver distraction was present in 63% of rear-end collisions in this segment, with one-third of those attributed to cell phone use.
ABOUT THE DATA
These insights were derived from Lytx’s proprietary database of utilities driving data from 2019, including 202,000 risky utilities driving events captured last year. For comparisons across industries, Lytx calculated behavior averages from its global database, which contains driving data from trucking, distribution, concrete, construction, services, transit, government, and waste industries. Lytx maintains the fastest-growing proprietary database of professional driving data in the world, currently surpassing 120 billion miles of driving data. The data is anonymized, normalized, and in instances of behavior prevalence, generalizable to utilities fleets at large.
Field Services Industry Driving Risk
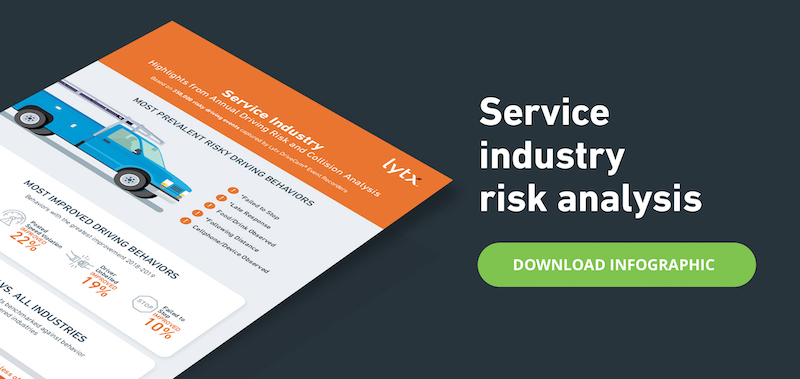
Lytx’s findings include the five risky behaviors seen most often among field service drivers, most improved driving behaviors, and insights on how driving habits in the field service industry compare to those in other industries.
This data was captured from fleets of all sizes and types within the field service industry, including heating, ventilation, and air conditioning (HVAC), contracting, plumbing, electrical, pest control, landscaping, cleaning, and more.
.jpeg "0420-MUL-200-031-banner-services-download-D2-(1).jpeg")
MOST PREVALENT RISKY BEHAVIORS IN 2019
- Failure to stop5
- Late response2
- Food/drink observed
- Following distance1
- Cell phone observed
MOST IMPROVED BEHAVIORS FROM 2018 TO 2019
- Following distance1 – improved 46%
- Posted-speed violation – improved 22%
- Driver unbelted – improved 19%
- Failure to stop5 – improved 10%
Behaviors may appear on both the "Most Prevalent" and "Most Improved" lists. This demonstrates that even with significant improvement, fleets and drivers must stay vigilant and maintain awareness to keep those behaviors trending downwards.
HOW FIELD SERVICES FLEETS STACK UP AGAINST OTHER INDUSTRIES
Lytx compared the prevalence of behaviors seen in field services fleets against behavior averages of fleets across all its other protected industries. Comparatively, field services fleets stood out in the following areas:
- Posted-speed violation, which occurred 26% less often
- Cell phone observed, which occurred 17% more often
Common risky driving behaviors observed within a fleet, as well as benchmarking data from fleets both inside and outside of a specific industry are helpful metrics for understanding industry-specific challenges, guiding safety efforts and then measuring success. To better identify and address top areas of driving risk within their individual fleets, thousands of organizations use the best-in-class Lytx Driver Safety Program; these organizations experience on average up to 50% reduction in collisions and up to 80% on associated claims costs as a result.
FIELD SERVICES COLLISION INSIGHT
Lytx also found that 62% of collisions in the field services segment were rear end or backing related, signaling an opportunity for targeted driver training to reduce these occurrences.
Lytx also found that 62% of collisions in the field service segment were rear-end or backing-related occurrences. Even at low speeds, rear-end collisions can lead to costly litigation. Two key ways to reduce rear-end collision potential are maintaining a safe following distance and eliminating in-cab distractions, such as cell phone use.
ABOUT THE DATA
These insights were derived from Lytx’s proprietary database of field service driving data from 2019, including 358,000 risky field service driving events captured last year. For comparisons across industries, Lytx calculated behavior averages from its global database, which contains driving data from trucking, distribution, concrete, construction, utilities, transit, government, and waste industries. Lytx maintains the fastest-growing proprietary database of professional driving data in the world, currently surpassing 120 billion miles of driving data. The data is anonymized, normalized, and in instances of behavior prevalence, generalizable to service fleets at large.
Trucking Industry Driving Risk
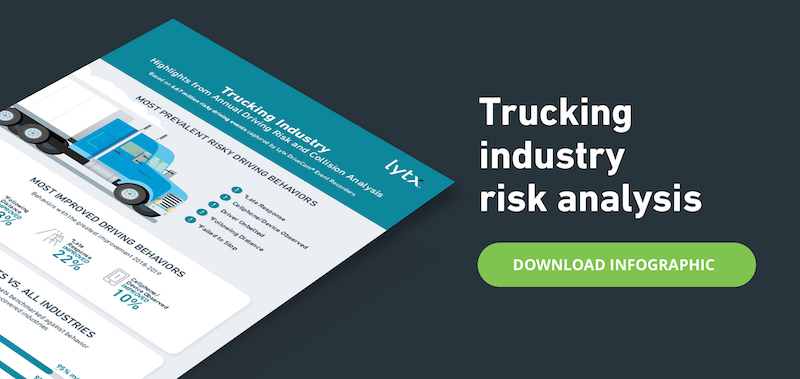
Lytx’s findings include the five risky behaviors seen most often among trucking drivers, most improved driving behaviors, and insights on how trucking-industry driving habits compare to those of other industries.
This data was captured from fleets of all sizes and types within the trucking industry, including for-hire, freight, long-haul and over-the-road fleets.
.jpeg "0420-MUL-200-031-banner-trucking-download-D2-(1).jpeg")
MOST PREVALENT RISKY BEHAVIORS IN 2019
- Late response2
- Cell phone/device observed
- Driver unbelted
- Following distance1
- Failed to stop
MOST IMPROVED BEHAVIORS FROM 2018 TO 2019
- Following distance1 – improved 48%
- Late response2 – improved 22%
- Cell phone/device – improved 10%
Behaviors may appear on both the "Most Prevalent" and "Most Improved" lists. This demonstrates that even with significant improvement, fleets and drivers must stay vigilant and maintain awareness to keep those behaviors trending downwards.
HOW TRUCKING FLEETS STACK UP AGAINST OTHER INDUSTRIES
Lytx compared the prevalence of behaviors seen in trucking fleets against behavior averages of fleets across all of its other protected industries. Comparatively, trucking fleets stood out in the following areas:
- Cell phone/device observed 95% more often
- Smoking observed 92% more often
Common risky driving behaviors observed within a fleet, as well as benchmarking data from fleets both inside and outside of a specific industry are helpful metrics for understanding industry-specific challenges, guiding safety efforts and then measuring success. To better identify and address top areas of driving risk within their individual fleets, thousands of organizations use the best-in-class Lytx Driver Safety Program; these organizations experience on average up to 50% reduction in collisions and up to 80% on associated claims costs as a result.
ABOUT THE DATA
These insights were derived from Lytx’s proprietary database of trucking driving data from 2019, including 6.67 million risky trucking driving events captured last year. For comparisons across industries, Lytx calculated behavior averages from its global database, which contains driving data from utilities, distribution, concrete, construction, services, transit, government and waste industries. Lytx maintains the fastest-growing proprietary database of professional driving data in the world, currently surpassing 120 billion miles of driving data. The data is anonymized, normalized and in instances of behavior prevalence, is generalizable to trucking fleets at large.
Distribution Industry Driving Risk
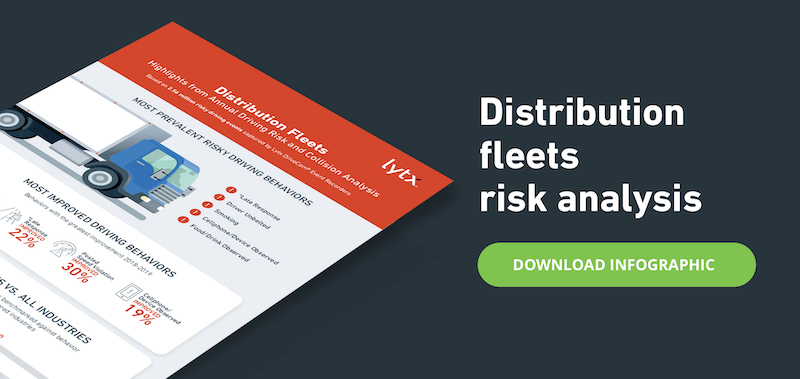
Lytx’s findings include the five risky behaviors seen most often among distribution drivers, most improved driving behaviors, and insights on how distribution industry driving habits compare to those of other industries.
This data was captured from fleets of all sizes and types within the distribution industry, including food and beverage, moving and storage, and gas and petroleum distribution fleets, among others.
.jpeg "0420-MUL-200-031-banner-distribution-download-D2-(1).jpeg")
MOST PREVALENT RISKY BEHAVIORS IN 2019
- Late response2
- Driver unbelted
- Smoking
- Cellphone/device observed
- Food/drink observed
MOST IMPROVED BEHAVIORS FROM 2018 TO 2019
- Following distance1 – improved 60%
- Late response2 – improved 22%
- Posted speed violation – improved 30%
- Cell phone/device – improved 19%
Behaviors may appear on both the "Most Prevalent" and "Most Improved" lists. This demonstrates that even with significant improvement, fleets and drivers should stay vigilant and maintain awareness to keep those behaviors trending downwards.
HOW DISTRIBUTION FLEETS STACK UP AGAINST OTHER INDUSTRIES
Lytx compared the prevalence of behaviors seen in distribution fleets against behavior averages of fleets across all of its other protected industries. Comparatively, distribution fleets stood out in the following areas:
- Food/drink, which was observed 50% more often
- Driver unbelted, which occurred 26% more often
- Failure to stop5 or incomplete stop6, which occurred 15% less often
Common risky driving behaviors observed within a fleet, as well as benchmarking data from fleets both inside and outside of a specific industry are helpful metrics for understanding industry-specific challenges, guiding safety efforts and then measuring success. To better identify and address top areas of driving risk within their individual fleets, thousands of organizations use the best-in-class Lytx Driver Safety Program; these organizations experience on average up to 50% reduction in collisions and up to 80% on associated claims costs as a result.
DISTRIBUTION COLLISION INSIGHT
Lytx also found that drivers observed falling asleep or drowsy represented 64% of medium-impact, fixed-object collisions among distribution fleets in 2019. While “falling asleep” and “drowsy” are not among the most prevalent behaviors in the distribution industry, they are far more likely to lead to a collision.
“There is no magic pill for eliminating the risk of tired drivers behind the wheel, but a great first step is to implement a fatigue management plan (FMP) that outlines causes, controls and strategies for both preventing and dealing with fatigue on the road in order to keep drivers safe,” said Del Lisk, Lytx’s vice president of safety services. “If you don’t have an FMP, a great place to start is to review the free template available from the North American Fatigue Management Program.”
ABOUT THE DATA
These insights were derived from Lytx’s proprietary database of distribution driving data from 2019, including 2.56 million risky distribution driving events captured last year. For comparisons across industries, Lytx calculated behavior averages from its global database, which contains driving data from trucking, utilities, concrete, construction, service, transit, government and waste industries. Lytx maintains the fastest-growing proprietary database of professional driving data in the world, currently surpassing 120 billion miles of driving data. The data is anonymized, normalized and in instances of behavior prevalence, is generalizable to distribution fleets at large.
Waste Industry Driving Risk
Lytx’s findings include the five risky behaviors seen most often among waste drivers, most improved driving behaviors, and insights on how waste-industry driving habits compare to those of other industries.
This data was captured from fleets of all sizes and types within the waste industry, including recycling, disposal and sanitation fleets.
.jpeg "0420-MUL-200-031-banner-waste-download-D2-(1).jpeg")
MOST PREVALENT RISKY BEHAVIORS IN 2019
- Smoking
- Driver unbelted
- Late response2
- Food/drink observed
- Near collision (unavoidable)
MOST IMPROVED BEHAVIORS FROM 2018 TO 2019
- Late response2 – improved 20%
- Driver unbelted – improved 6%
HOW WASTE FLEETS STACK UP AGAINST OTHER INDUSTRIES
Lytx compared the prevalence of behaviors seen in waste fleets against behavior averages of fleets across all of its other protected industries. Comparatively, waste fleets stood out in the following areas:
- Smoking observed 22% more often
- Driver unbelted occurred 22% less often
Common risky driving behaviors observed within a fleet, as well as benchmarking data from fleets both inside and outside of a specific industry are helpful metrics for understanding industry-specific challenges, guiding safety efforts and then measuring success. To better identify and address top areas of driving risk within their individual fleets, thousands of organizations use the best-in-class Lytx Driver Safety Program; these organizations experience on average up to 50% reduction in collisions and up to 80% on associated claims costs as a result.
WASTE COLLISION INSIGHT
Lytx also found that 28% of high-impact waste-industry collisions were due to drivers driving too fast for the conditions. When it comes to low-impact collisions, nearly one-in-four were due to distractions, such as smoking, food and drink and cell phone/device use.
ABOUT THE DATA
These insights were derived from Lytx’s proprietary database of waste driving data from 2019, including 686,000 risky waste driving events captured last year. For comparisons across industries, Lytx calculated behavior averages from its global database, which contains driving data from trucking, distribution, concrete, construction, services, transit, government and utilities industries. Lytx maintains the fastest-growing proprietary database of professional driving data in the world, currently surpassing 120 billion miles of driving data. The data is anonymized, normalized and in instances of behavior prevalence, is generalizable to waste fleets at large.
Transit Industry Driving Risk
Lytx’s findings include the five risky behaviors seen most often among transit drivers, most improved driving behaviors, and insights on how transit industry driving habits compare to those of other industries.
This data was captured from fleets of all sizes and types within the transit industry, including taxi, limousine, airport shuttle, coach and school bus fleets, among others.
.jpeg "0420-MUL-200-031-banner-transit-download-D2-(1).jpeg")
MOST PREVALENT RISKY BEHAVIORS IN 2019
- Late response2
- Near collision
- Incomplete stop
- Following distance1
- Driver unbelted
MOST IMPROVED BEHAVIORS FROM 2018 TO 2019
- Failure to stop5 – improved 32%
- Posted speed violation – improved 24%
- Late response2 – improved 10%
Behaviors may appear on both the "Most Prevalent" and "Most Improved" lists. This demonstrates that even with significant improvement, fleets and drivers must stay vigilant and maintain awareness to keep those behaviors trending downwards.
HOW TRANSIT FLEETS STACK UP AGAINST OTHER INDUSTRIES
Lytx compared the prevalence of behaviors seen in transit fleets against behavior averages of fleets across all of its other protected industries. Comparatively, transit fleets stood out in the following areas:
- Near collision/near collision (unavoidable) occurred 31% more often
- Incomplete stop occurred 18% more often
- Food/drink observed 60% less often
Common risky driving behaviors observed within a fleet, as well as benchmarking data from fleets both inside and outside of a specific industry are helpful metrics for understanding industry-specific challenges, guiding safety efforts and then measuring success. To better identify and address top areas of driving risk within their individual fleets, thousands of organizations use the best-in-class Lytx Driver Safety Program; these organizations experience on average up to 50% reduction in collisions and up to 80% on associated claims costs as a result.
TRANSIT COLLISION INSIGHT
Lytx also found that 57% of high-impact collisions in the transit industry were attributed to fundamentals or traffic violation behaviors, such as “failure to stop” or “too fast for conditions,” indicating an opportunity for increased operator and driver coaching in this area.
ABOUT THE DATA
These insights were derived from Lytx’s proprietary database of transit driving data from 2019, including 808,000 risky transit driving events captured last year. For comparisons across industries, Lytx calculated behavior averages from its global database, which contains driving data from trucking, distribution, concrete, construction, services, utilities, government and waste industries. Lytx maintains the fastest-growing proprietary database of professional driving data in the world, currently surpassing 120 billion miles of driving data. The data is anonymized, normalized and in instances of behavior prevalence, is generalizable to transit fleets at large.
Public Sector Driving Risk
Lytx’s findings include the five risky behaviors seen most often among public-sector drivers, most improved driving behaviors, and insights on how public-sector driving habits compare to those of other industries.
This data was captured from fleets of all sizes and types within the public sector, including public works, public schools, transit, waste, fire, police and EMS fleets, as well as city/municipal vehicles.
.jpeg "0420-MUL-200-031-banner-government-fleets-download-D3-(1).jpeg")
MOST PREVALENT RISKY BEHAVIORS IN 2019
- Driver unbelted
- Cell phone/device observed
- Red light7
- Passenger unbelted
- Failure to stop5
MOST IMPROVED BEHAVIORS FROM 2018 TO 2019
- Following distance1 – improved 57%
- Late response2 – improved 18%
- Posted speed violation – improved 10%
Behaviors may appear on both the "Most Prevalent" and "Most Improved" lists. This demonstrates that even with significant improvement, fleets and drivers must stay vigilant and maintain awareness to keep those behaviors trending downwards.
HOW PUBLIC-SECTOR FLEETS STACK UP AGAINST OTHER INDUSTRIES
Lytx compared the prevalence of behaviors seen in public-sector fleets against behavior averages of fleets across all of its other protected industries. Comparatively, public-sector fleets stood out in the following areas:
- Following distance1 occurred 53% less often
- Red light7 occurred 104% more often
- Failure to stop5 occurred 35% more often
High instances of “red light” and “failed to stop” behaviors are likely due to the high-level of emergency situations certain fleets in this sector, such as police, fire and EMS, often find themselves in.
Common risky driving behaviors observed within a fleet, as well as benchmarking data from fleets both inside and outside of a specific industry are helpful metrics for understanding industry-specific challenges, guiding safety efforts and then measuring success. To better identify and address top areas of driving risk within their individual fleets, thousands of organizations use the best-in-class Lytx Driver Safety Program; these organizations experience on average up to 50% reduction in collisions and up to 80% on associated claims costs as a result.
PUBLIC-SECTOR COLLISION INSIGHT
Lytx also found that 55% of medium-impact collisions among public-sector fleets involved a side impact. Of those, 40% involved traffic violations, such as “failure to stop,” potentially indicative of emergency-response situations.
ABOUT THE DATA
These insights were derived from Lytx’s proprietary database of public-sector driving data from 2019, including 328,000 risky public-sector driving events captured last year. For comparisons across industries, Lytx calculated behavior averages from its global database, which contains driving data from trucking, distribution, concrete, construction, services, transit, utilities and waste industries. Lytx maintains the fastest-growing proprietary database of professional driving data in the world, currently surpassing 120 billion miles of driving data. The data is anonymized, normalized and in instances of behavior prevalence, is generalizable to public-sector fleets at large.
1 Following distance refers to a risky driving event in which the distance to the vehicle directly ahead was approximately 1.5 seconds and note increasing for at least 4 consecutive seconds.
2 Late response occurs when a driver was not distracted, yet responded late and abruptly to a readily visible risky situation ahead.
3 Too fast for conditions occurs when a vehicle seems to be traveling at a speed greater than reasonable for the given conditions. The driver may not exceed the posted speed limit but may be driving too fast for the environment. Environmental considerations include dense traffic conditions, heavy pedestrian activity, inclement weather, icy or wet road conditions, construction zones, narrow pathways, and poor visibility.
4 Other distraction occurs when a driver was distracted by something Lytx does not explicitly capture (i.e., cell phone, other device, food/drink or passenger); examples include directing too much attention to other drivers or pedestrians, lighting a cigarette or viewing paperwork.
5 Failure to stop occurs when a driver fails to stop at a stop sign or his/her speed remains above 5 mph.
6 Incomplete stop occurs when a driver was below 5 mph and the vehicle did not come to a complete stop or a stop at a stop sign or while turning right at a red light.